Tornado Alley Map
Tornado Alley has no official boundary: NOAA's storm lab calls it a nickname invented by the media. Mapping every tornado NOAA recorded from 2021–2025, the most per square mile fall in Mississippi, Illinois and Alabama, and 51% come in March, April and May.
Where tornadoes touch down
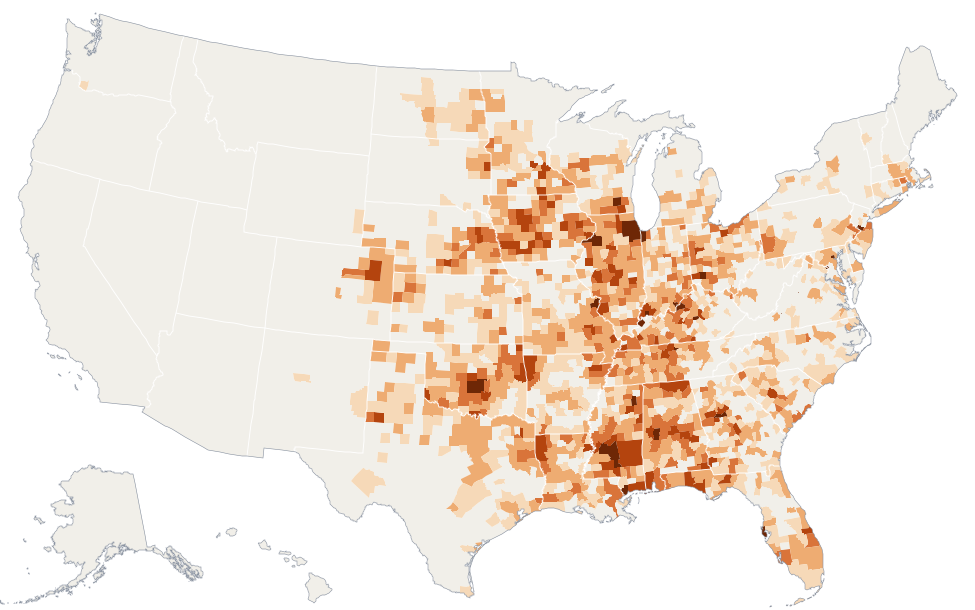
- None
- 0.5–1
- 1–2
- 2–3
- 3–5
- 5+
Tornado season
Nationally, tornado reports peak in May. NOAA notes the threat shifts from the Southeast in the cooler months toward the southern and central Plains in May and June.
Tornadoes by state
| 1 | Mississippi | 23.4 | 112 | 16.8 | 34 | March |
| 2 | Illinois | 20.6 | 116 | 10.4 | 10 | July |
| 3 | Alabama | 18.7 | 97.0 | 16.2 | 23 | March |
| 4 | Iowa | 17.0 | 95.4 | 14.8 | 13 | April |
| 5 | Oklahoma | 14.7 | 103 | 9.4 | 12 | May |
| 6 | Indiana | 13.1 | 47.2 | 7.2 | 8 | March |
| 7 | Louisiana | 12.5 | 59.6 | 8.0 | 7 | May |
| 8 | Ohio | 12.2 | 50.2 | 6.0 | 3 | April |
| 9 | Kentucky | 12.1 | 49.0 | 8.6 | 94 | December |
| 10 | Tennessee | 11.7 | 49.2 | 10.6 | 31 | December |
| 11 | Florida | 10.8 | 63.4 | 6.4 | 10 | October |
| 12 | Missouri | 9.6 | 66.6 | 11.8 | 24 | May |
| 13 | New Jersey | 9.5 | 7.4 | 1.6 | 0 | April |
| 14 | Arkansas | 9.5 | 50.6 | 10.6 | 11 | May |
| 15 | Georgia | 9.3 | 54.6 | 6.4 | 7 | April |
| 16 | South Carolina | 9.0 | 28.0 | 1.6 | 0 | August |
| 17 | Nebraska | 8.1 | 62.2 | 7.6 | 0 | May |
| 18 | Maryland | 7.5 | 7.8 | 0.6 | 0 | June |
| 19 | Wisconsin | 7.1 | 39.6 | 3.6 | 0 | May |
| 20 | Minnesota | 6.2 | 51.8 | 2.6 | 0 | May |
| 21 | Kansas | 6.1 | 49.8 | 5.8 | 0 | May |
| 22 | Pennsylvania | 5.7 | 26.0 | 2.4 | 1 | May |
| 23 | North Carolina | 5.3 | 26.6 | 1.8 | 5 | May |
| 24 | Connecticut | 5.2 | 2.6 | 0.0 | 0 | November |
| 25 | Massachusetts | 5.1 | 4.2 | 0.0 | 0 | August |
| 26 | Texas | 4.7 | 124 | 20.2 | 21 | May |
| 27 | Colorado | 4.2 | 43.8 | 2.6 | 0 | June |
| 28 | North Dakota | 4.1 | 28.6 | 2.4 | 3 | June |
| 29 | Michigan | 3.2 | 18.8 | 1.6 | 5 | May |
| 30 | New York | 2.8 | 13.8 | 1.2 | 4 | July |
| 31 | Virginia | 2.8 | 11.2 | 1.0 | 0 | May |
| 32 | South Dakota | 2.7 | 21.0 | 2.8 | 0 | May |
| 33 | West Virginia | 2.2 | 5.4 | 0.8 | 0 | April |
| 34 | New Mexico | 1.0 | 11.6 | 0.0 | 0 | May |
| 35 | Wyoming | 0.8 | 7.8 | 0.6 | 0 | June |
| 36 | Arizona | 0.6 | 7.0 | 0.0 | 0 | June |
| 37 | California | 0.3 | 5.2 | 0.0 | 0 | January |
| 38 | Washington | 0.3 | 2.2 | 0.0 | 0 | May |
| 39 | Utah | 0.3 | 2.4 | 0.6 | 0 | July |
| 40 | Oregon | 0.2 | 2.4 | 0.0 | 0 | June |
| 41 | Montana | 0.2 | 2.8 | 0.2 | 0 | July |
| – | Delaware | – | 1.6 | 0.2 | 1 | July |
| – | Idaho | – | 1.6 | 0.0 | 0 | May |
| – | Rhode Island | – | 1.4 | 0.2 | 0 | November |
| – | New Hampshire | – | 1.0 | 0.0 | 0 | July |
| – | Vermont | – | 0.8 | 0.0 | 0 | July |
| – | Nevada | – | 0.6 | 0.0 | 0 | August |
| – | District of Columbia | – | 0.4 | 0.0 | 0 | July |
| – | Alaska | – | 0.2 | 0.0 | 0 | April |
| – | Hawaii | – | 0.0 | 0.0 | 0 | – |
| – | Maine | – | 0.0 | 0.0 | 0 | – |
Counties with the most tornadoes per square mile
| Spalding County, Georgia | 11.1 | 2.2 | 0.8 |
| DuPage County, Illinois | 10.7 | 3.6 | 0.2 |
| Floyd County, Indiana | 9.2 | 1.4 | 0.0 |
| Trousdale County, Tennessee | 8.8 | 1.0 | 0.2 |
| Kendall County, Illinois | 8.1 | 2.6 | 0.0 |
| Cleveland County, Oklahoma | 7.9 | 4.4 | 0.8 |
| Jefferson Davis County, Mississippi | 7.8 | 3.2 | 0.6 |
| McClain County, Oklahoma | 7.6 | 4.4 | 0.8 |
| Kane County, Illinois | 7.3 | 3.8 | 0.0 |
| Vanderburgh County, Indiana | 6.9 | 1.6 | 0.4 |
| Simpson County, Mississippi | 6.8 | 4.0 | 0.0 |
| Pottawatomie County, Oklahoma | 6.6 | 5.2 | 1.0 |
| St. Louis County, Missouri | 6.5 | 3.4 | 0.4 |
| Boyle County, Kentucky | 6.5 | 1.2 | 0.2 |
| Butts County, Georgia | 6.3 | 1.2 | 0.2 |
How this map is built
Every tornado in NOAA's Storm Events Database from 2021–2025, counted in each county it touched and averaged per year, then divided by the county's area. NOAA logs a tornado once for each county it crosses, so these are county tornado reports: a long-track tornado counts in every county on its path. EF ratings come from National Weather Service damage surveys; "EFU" (unknown) tornadoes count in the totals but not as EF2+.
This is a record of past tornadoes, not a forecast or a live tracker. For warnings, follow your local National Weather Service office. Full methodology.
Cite: Home Stats Data, "Tornado Alley Map," https://homestatsdata.com/storm-risk/tornado-alley-map/